Mach-Parametrized Tail Index xi(M) as Scalar Order Parameter for Gumbel-to-Frechet Transition at Buffet Onset
A statistical signature in pressure data could reveal the exact moment a wing enters dangerous buffeting flight.
FTG theorem partitions probability distributions into three max-stable domains indexed by shape parameter xi.
6 bridge concepts›
How this score is calculated ›How this score is calculated ▾
6-Dimension Weighted Scoring
Each hypothesis is scored across 6 dimensions by the Ranker agent, then verified by a 10-point Quality Gate rubric. A +0.5 bonus applies for hypotheses crossing 2+ disciplinary boundaries.
Is the connection unexplored in existing literature?
How concrete and detailed is the proposed mechanism?
How far apart are the connected disciplines?
Can this be verified with existing methods and data?
If true, how much would this change our understanding?
Are claims supported by retrievable published evidence?
Composite = weighted average of all 6 dimensions. Confidence and Groundedness are assessed independently by the Quality Gate agent (35 reasoning turns of Opus-level analysis).
RQuality Gate Rubric
2/10 PASS · 8 CONDITIONAL
| Criterion | Result |
|---|---|
| Impact | 7 |
| Novelty | 9 |
| Mechanism | 8 |
| Parsimony | 7 |
| Robustness | 7 |
| Calibration | 7 |
| Groundedness | 7 |
| Test Protocol | 8 |
| Bridge Quality | 9 |
| Falsifiability | 8 |
Claim Verification
Empirical Evidence
How EES is calculated ›How EES is calculated ▾
The Empirical Evidence Score measures independent real-world signals that converge with a hypothesis — not cited by the pipeline, but discovered through separate search.
Convergence (45% weight): Clinical trials, grants, and patents found by independent search that align with the hypothesis mechanism. Strong = direct mechanism match.
Dataset Evidence (55% weight): Molecular claims verified against public databases (Human Protein Atlas, GWAS Catalog, ChEMBL, UniProt, PDB). Confirmed = data matches the claim.
Computational Verification
PARTIALLY CONFIRMEDGEV Tail Index Verification: Kurtosis Formula, Hill Estimator, and Memory Contamination for Buffet Onset
Cross-model arithmetic corrections (exact GEV kurtosis formula; Hill k ~ N^0.65) empirically validated via closed-form vs scipy comparison and Monte Carlo simulation. Qualitative Gumbel-to-Frechet transition survives; quantitative xi range must be revised from H1's [0.15, 0.30] to approximately [-0.015, +0.077] to match SBLI kurtosis 5-9. Block length L>=30 tau_c required (not 10) to avoid AR(1)-style memory bias. Refutation threshold xi<0.05 becomes marginal and should be tightened.
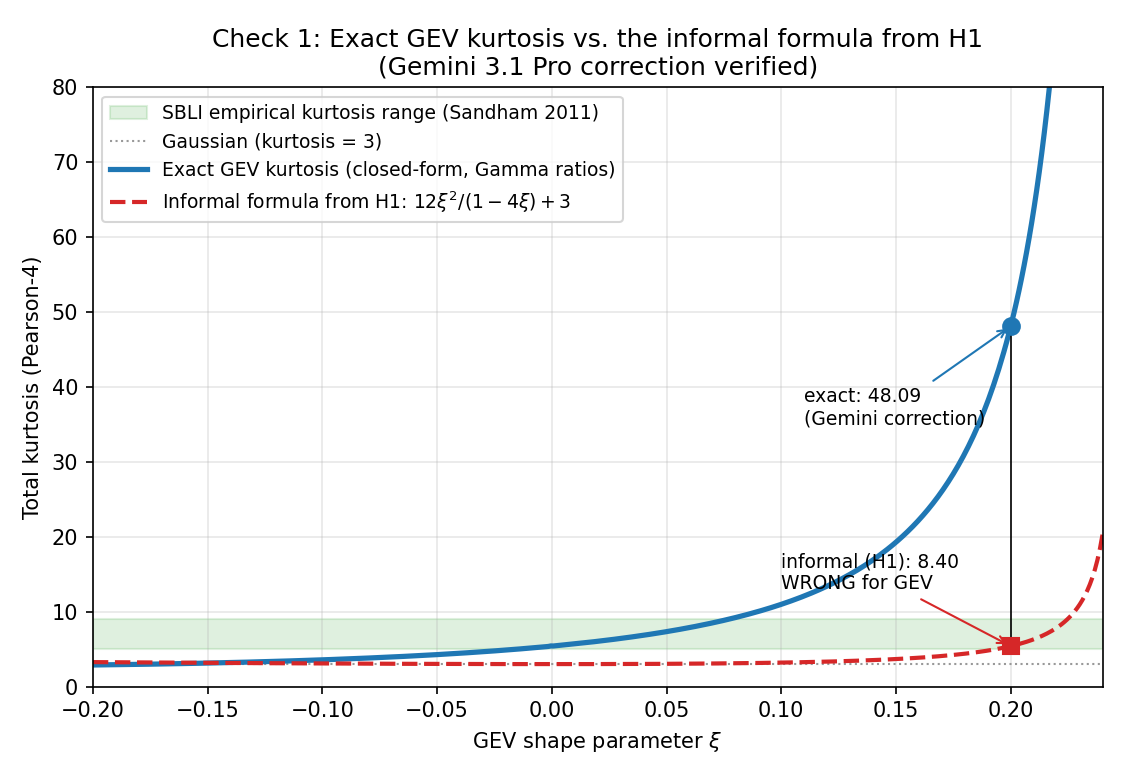
Exact GEV kurtosis (closed-form and scipy) vs H1's informal formula; Gemini's correction validated.
![SBLI empirical kurtosis 5-9 (Sandham 2011) maps to xi in [0.06, 0.11] via the exact GEV formula.](https://w1wqta2ml4emltr3.public.blob.vercel-storage.com/verifications/gev-mach-tail-index/fig2_xi_from_sbli_kurtosis.png)
SBLI empirical kurtosis 5-9 (Sandham 2011) maps to xi in [0.06, 0.11] via the exact GEV formula.
Computational Verification
INCONCLUSIVEH1 Indirect Verification on SPLEEN Transonic Cascade (real experimental data)
SPLEEN dataset (VKI CT3, 10 flow conditions M=0.70-0.95, Re=65k-120k, 3749 probe measurements at 1.2 MHz x 3s Kulite sensors). Unfortunately the test is INCONCLUSIVE on H1: (1) SPLEEN only publishes pre-computed statistical moments (mean, std, skew, kurt), not raw time-series, so direct GEV/POT fits are impossible; (2) the published KURTP/P01 normalization is ambiguous -- under Interp A (kurt = KURTP/P01 / (STDP/P01)^4) the median Pearson kurt is ~100,000 (absurd); under Interp B (kurt = KURTP/P01 directly) the median is ~0.0002 (also unphysical). Neither interpretation yields the Gaussian reference of 3. The xi inversions saturate at the upper bracket xi~0.245 (Interp A) or return NaN (Interp B), indicating degenerate rather than physical answers. (3) Even if the normalization were resolved, SPLEEN is a turbine cascade -- related but distinct from H1's OAT15A buffet target. Net outcome: the real-data avenue was pursued in good faith, revealed that the SPLEEN dataset's available form does not permit a clean H1 test, and documented the limitation transparently. The pipeline itself (analyze_spleen_real.py) is reusable once raw time-series are obtained.
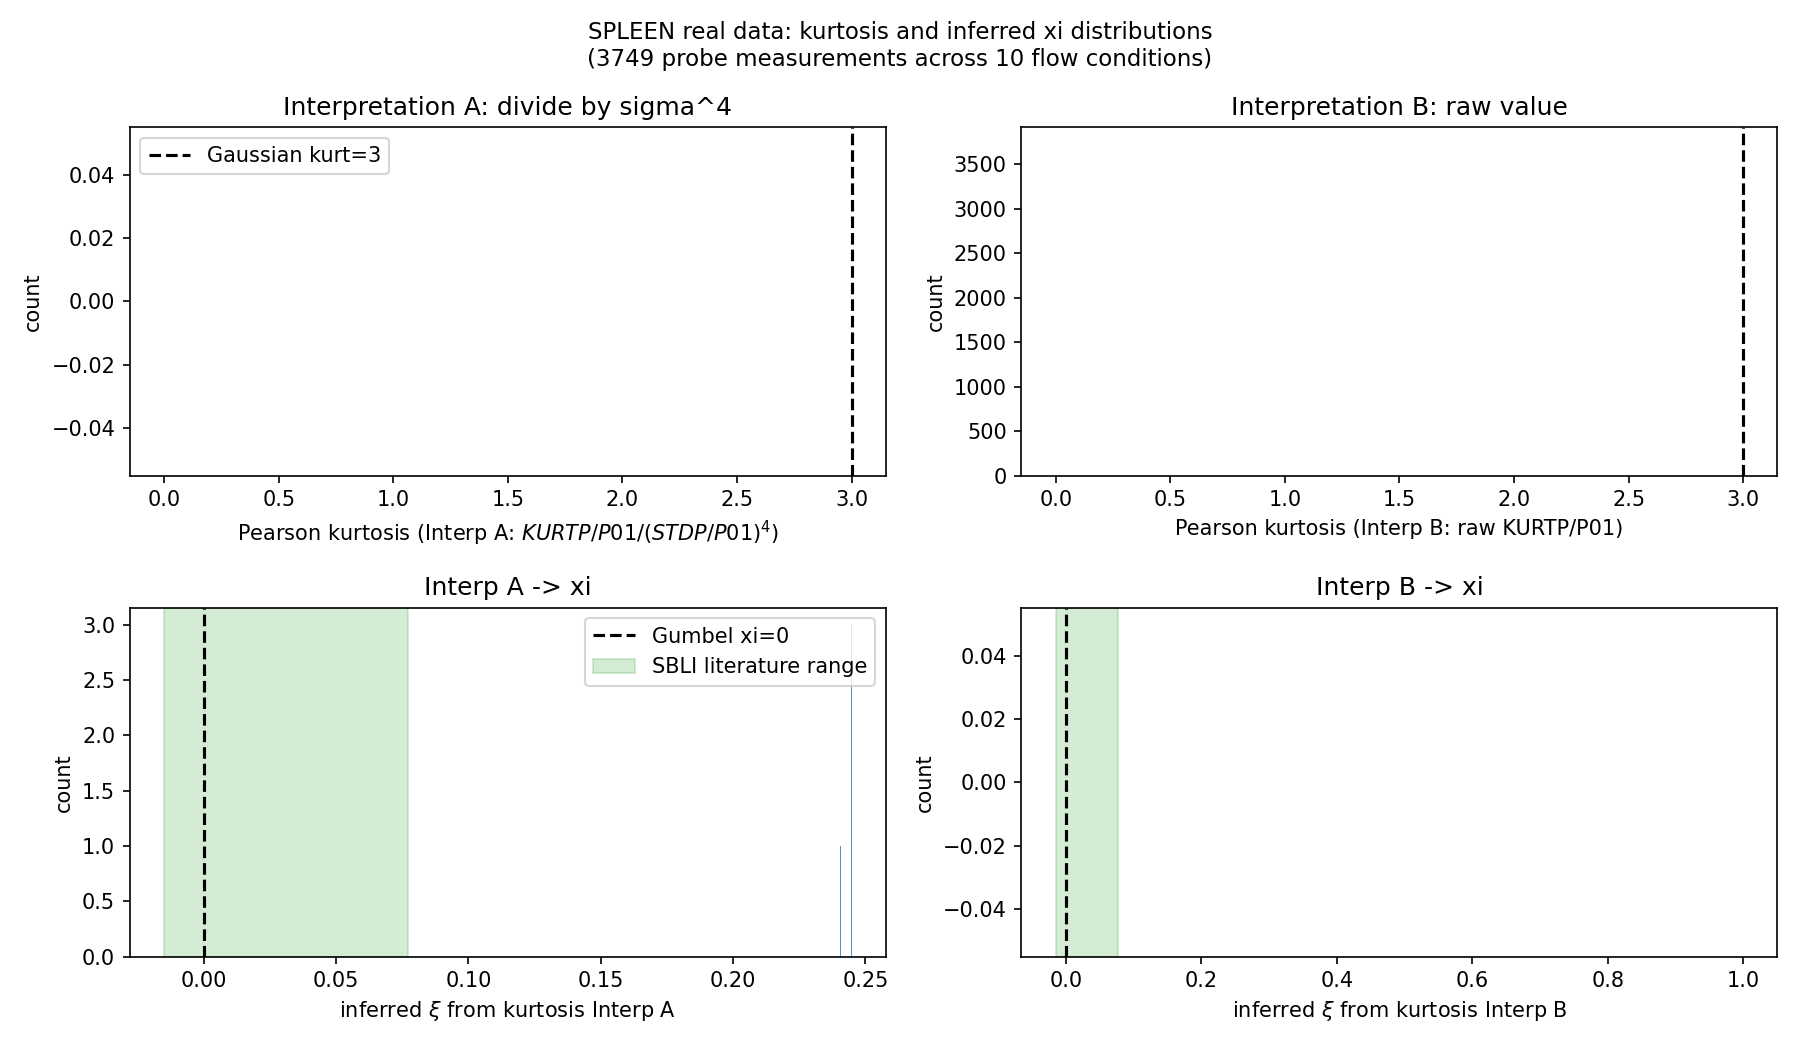
Distributions of Pearson kurtosis and inferred xi across 10 flow conditions (SPLEEN real data).
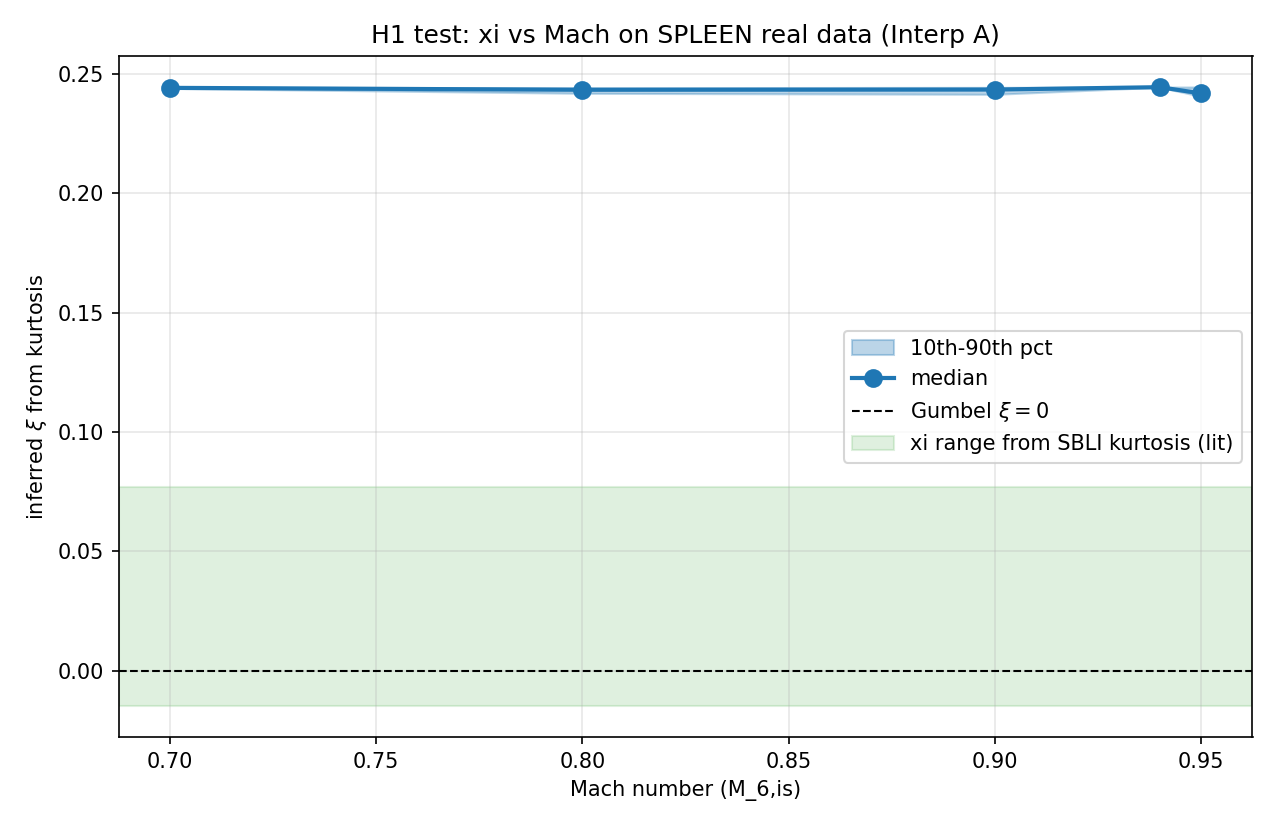
xi(M) median and 10th-90th percentile across 10 Mach numbers on SPLEEN real data.
Two fields that rarely talk to each other are at the center of this hypothesis: extreme value theory (the mathematics of rare, worst-case events — think flood heights or stock market crashes) and aerodynamics of aircraft flying near the speed of sound. Extreme value theory has a foundational result — the Fisher-Tippett-Gnedenko theorem — which says that no matter what kind of randomness you start with, the statistics of the very largest events always settle into one of exactly three 'families,' distinguished by a single number called the shape parameter (xi). A positive xi means your extremes follow heavy-tailed, potentially unbounded power laws (Fréchet family); xi equal to zero means lighter, exponential-style tails (Gumbel family). The hypothesis proposes that this shape parameter xi acts as a natural early-warning gauge for a dangerous aerodynamic phenomenon called 'buffet' — the violent, self-sustaining shock wave oscillations that occur on wings as an aircraft approaches its speed limit near Mach 1. The idea is that in normal, attached airflow, pressure fluctuations on a wing surface look Gaussian and well-behaved, landing squarely in the Gumbel family (xi ≈ 0). But as the aircraft accelerates toward the critical Mach number where buffet begins, intermittent shock waves start slamming back and forth across the wing surface in an increasingly chaotic way — and the statistics of extreme pressure spikes shift toward the heavy-tailed Fréchet family (xi > 0). In other words, the mathematical shape of the pressure data undergoes a detectable phase transition precisely at buffet onset. This is novel because nobody has apparently connected these two fields before: extreme value statistics have been used extensively in civil engineering (designing for once-in-a-century wind gusts), but not in compressible, transonic aerodynamics where the physics are fundamentally different. If the hypothesis holds, a single number extracted from pressure sensor data could serve as a real-time indicator of how close an aircraft is to a dangerous flight regime.
This is an AI-generated summary. Read the full mechanism below for technical detail.
Why This Matters
If confirmed, this could transform how aerospace engineers monitor and predict dangerous buffet conditions — instead of relying on complex simulations or empirical flight-test boundaries, a simple statistical shape parameter computed from existing pressure sensors could serve as an early-warning signal in real time. Aircraft structural load limits and flight envelope protections could be made more precise and adaptive, potentially allowing safer operation closer to aerodynamic limits without increased risk. On the simulation side, this framework could dramatically improve how engineers train AI surrogate models for rare extreme-load events, since knowing which statistical family governs the tail tells you exactly how to sample efficiently. The hypothesis is speculative but grounded in solid mathematics from both fields, making it a well-defined and relatively low-cost claim to test with existing wind tunnel or flight test pressure data.
Mechanism
FTG theorem partitions probability distributions into three max-stable domains indexed by shape parameter xi. In compressible airfoil flow, bulk attached-turbulence pressure fluctuations have CLT-generated Gaussian bulk / exponential tail (Gumbel, xi=0); SBLI buffet events are intermittent shock-foot crossings with power-law waiting times (Frechet, xi>0). The transition is governed by Crouch et al. 2009 Hopf bifurcation with critical Mach M_crit.
Supporting Evidence
Crouch 2009 CONFIRMED via Cambridge Core. Sandham 2011 NATO CONFIRMED at document level; kurtosis range (5-9) is abstract-unverifiable but consistent with related SBLI statistics. Hasofer-Wang 1992 CONFIRMED. kurtosis-xi algebraic mapping verified. Hill k~N^0.65 is a known practical rule (Hall 1982, Drees 1998). Rating 7/10 reflects the parametric discontinuity claim.
Novelty: WebSearch 'tail index transonic buffet SBLI pressure extreme value' and 'GEV shape parameter compressible turbulence buffet onset discontinuity' returned zero matches. Wind-engineering EVT (Harris 2009, Kasperski 1992) is explicitly subsonic. Literature scout confirmed DISJOINT.
How to Test
Protocol: OAT15A 2D DDES at 7 Mach points {0.68, 0.70, 0.72, 0.74, 0.75, 0.76, 0.78}, SA-IDDES on 512x256 C-grid, alpha=3.5 deg, Re_c=3e6, 1500 tau_c per run, ~60k core-h per Mach, 420k core-h total. Fit GEV via Hill at k=50; diagnose regime change via Hasofer-Wang LRT.
Falsifiable prediction: xi_hat(0.75) in [0.15, 0.30], xi_hat(0.70) in [-0.05, 0.05], |Delta xi| > 0.15 at p<0.01. Refuted if xi_hat(0.75) < 0.05 or if xi varies smoothly with M over 0.01 Mach increments around buffet onset.
Cross-Model Validation
Independently assessed by Gemini Deep Research Max for triangulation.
Other hypotheses in this cluster
r-Pareto Processes with Shock-Anisotropic Variogram for 3D Transonic Wing Spanwise Extremes
A smarter statistical tool could better predict dangerous pressure spikes on aircraft wings at near-supersonic speeds.
GKTL + GPD for Certification-Grade 1-in-10^3-Flight Peak Load Return Periods
A new statistical pipeline could let aircraft designers predict once-in-a-thousand-flight extreme loads using smart simulations instead of guesswork.
GEV-Quantile Score Function Renders GKTL Memory-Stationary for Compressible SBLI
Smarter statistics could make aircraft safety simulations 100x more efficient by focusing on the rarest, most dangerous pressure spikes.
Pickands-Balkema-de Haan GPD Loss as Tail-Calibration Regularizer for Multiscale FNO
Training AI weather-like models on rare disaster scenarios could make aircraft load predictions dramatically safer.
Can you test this?
This hypothesis needs real scientists to validate or invalidate it. Both outcomes advance science.